
Linux Gaming and 3d accelerated productivity have come a long way in the past few years. Steam and GoG host thousands of Linux native titles, and things like computer vision and deep learning are mainstays for Linux GPGPU. Practically every render farm runs it, and serious commercial software like Nuke, Davinci Resolve, and Autodesk Maya are available for RHEL-based workstations.
Read Also: The Magewell USB Capture 2 is Great on Linux
What hasn’t progressed, though, is measurement and performance comparison tools for our Linux 3d applications. Thanks to the efforts of Michael Larabel over at Phoronix, there’s some rudimentary synthetic benchmarking support, but application agnostic tools like FRAPS and Presentmon are few and far between. Perhaps the project closest to completion, glxOSD, was abandoned years ago, and still lacks full logging functionality.
Having these tools is important because many games don’t have transparent logging for built in benchmarks, and often don’t faithfully report actual FPS or frame time data in the first place (this is a problem on any OS, but you can work around it more easily on Windows)
Debug Tools Offer Some Relief
Newer efforts like AMD’s Gpu Performance Studio and Nvidia’s Linux Graphics Debugger are promising, but were designed for debugging and render data capture on specific hardware. They’re a lot heavier than an ideal benchmarking tool needs to be, and they’re locked to their respective platforms.
Community interest in OpenGL/Vulkan Debug and capture tools for benchmarking, while it shows the sad state of things in the Linux ecosystem at present, also lead me to look for software with similar functionality that worked on all hardware. After some searching, I landed on a tool called Bugle, and it works much better than I could have hoped, at least for the purpose of precision frame data logging on 3d workloads.
So What Even Is Bugle?
Bugle (officially BuGLe) is a wrapper that, when called before a 3d application, will report data about that application according to a preset profile called a “chain.” This data can be piped to a number of locations or to a file. You can configure your chain to report things like fps, frame times, number of triangles, render passes per frame, draw calls per second, VRAM usage, GPU usage, number of primitives onscreen, and other OpenGL related statistics. You can even use it to detect if you’re experiencing a gpu bottleneck. It’s a very powerful piece of software, but for our purposes, we’ll just be using it to measure 3d performance over time via frame rate and timings.
Installation
This tool isn’t exactly a common type of software, so you’d be lucky to find an up-to-date version in your distro’s official repos. You’re more than likely going to need to compile it from source, as the only officially listed package is on gentoo(!)
First Off, Install the Build/Runtime Dependencies. On Centos/RHEL that’s
$ sudo yum install ffmpeg gtkglext gtkglext-devel freeglut python2-scons gtk+
you’re also going to want a simple 3d worlkoad to test your installation on, so install glxgears by running
$ sudo yum install glx-utils
Other distros will be similar, simply replace yum install with the appropriate package manager and make sure the -devel package syntax matches your distro’s way of naming dev tools.
Download the Source Tarball and extract it to a directory. Open a Terminal, Navigate to the directory you just unzipped and run
$ scons
$ sudo scons install
If all goes well, the installation should complete with no errors.
from here run
BUGLE_CHAIN= LD_PRELOAD=/usr/local/lib/libbugle.so glxgears
to start glxgears with the bugle wrapper enabled.
If you get a “cannot load shared object” error, you need to add the installed libraries to your LD_LIBRARY_PATH
To do this, open up your .bashrc in your favorite editor, for example
$ nano ~/.bashrc
add the line
export LD_LIBRARY_PATH=/usr/local/lib/:$LD_LIBRARY_PATH
save, and exit.
then run source ~/.bashrc and try again
Configuring Bugle Reporting/Logging
Bugle separates its logging/reporting functionality into 2 concepts: Chains and Stats. Stats are operations performed on opengl data to get coherent statistics like frames per second, or triangles per frame. Chains are calls that either log or show a number of stats according to your configuration. The tarball provides some example chains and stats in doc/examples, and you can use them immediately by pasting both files into ~/.bugle
However, Let’s say you want to log frame times and fps simultaneously with easily recogniseable names. You’d need to customize your filters file with a new chain to achieve this.
The example chain used to log FPS looks like this:
# Log FPS stats to bugle.log
chain logfps
{
filterset stats_basic
filterset logstats
{
show "frames per second"
}
filterset log
{
filename "bugle.log"
}
}
but we also want it to log frametimes, so we check the statistics file, and see that this is already defined as a filterset function via “ms per frame” — so we add this to the logstats section, and rename our log file and chain name to be identifiable, like so:
chain logboth
{
filterset stats_basic
filterset logstats
{
show "frames per second"
show "ms per frame"
}
filterset log
{
filename "both.log"
}
}
so now when you pass BUGLE_CHAIN=logboth when you start bugle, frametimes and fps will be logged to both.log in your working directory. You can also paste this chain to the top of the filters file to have it run automatically.
with the glxgears example, you should get log ouptut like this:
...
[INFO] logstats.frames per second: 59.7 fps
[INFO] logstats.ms per frame: 16.75 ms/frame
[INFO] logstats.frames per second: 58.4 fps
[INFO] logstats.ms per frame: 17.12 ms/frame
[INFO] logstats.frames per second: 60.0 fps
[INFO] logstats.ms per frame: 16.68 ms/frame
[INFO] logstats.frames per second: 60.0 fps
[INFO] logstats.ms per frame: 16.67 ms/frame
[INFO] logstats.frames per second: 59.5 fps
...
or without vsync:
...
[INFO] logstats.frames per second: 37939.1 fps
[INFO] logstats.ms per frame: 0.03 ms/frame
[INFO] logstats.frames per second: 39298.9 fps
[INFO] logstats.ms per frame: 0.03 ms/frame
[INFO] logstats.frames per second: 39191.1 fps
[INFO] logstats.ms per frame: 0.03 ms/frame
[INFO] logstats.frames per second: 39785.2 fps
[INFO] logstats.ms per frame: 0.03 ms/frame
...
and we can turn this into a parse-able csv by using a little one liner magic:
awk '{print $5" "$6}' both.log | sed 's/\n/,/g' | paste -d ', ' - - > both.csvfrom here, just open it in your favorite spreadsheet or visualization software and make your charts!
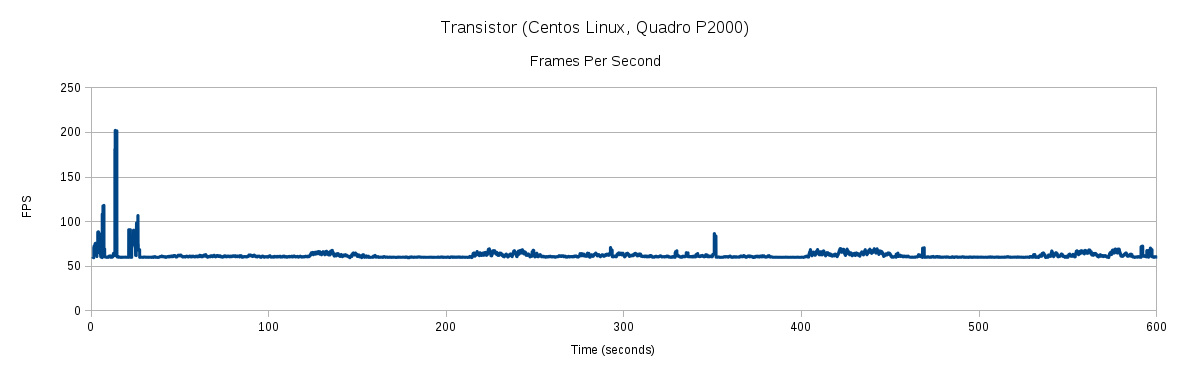
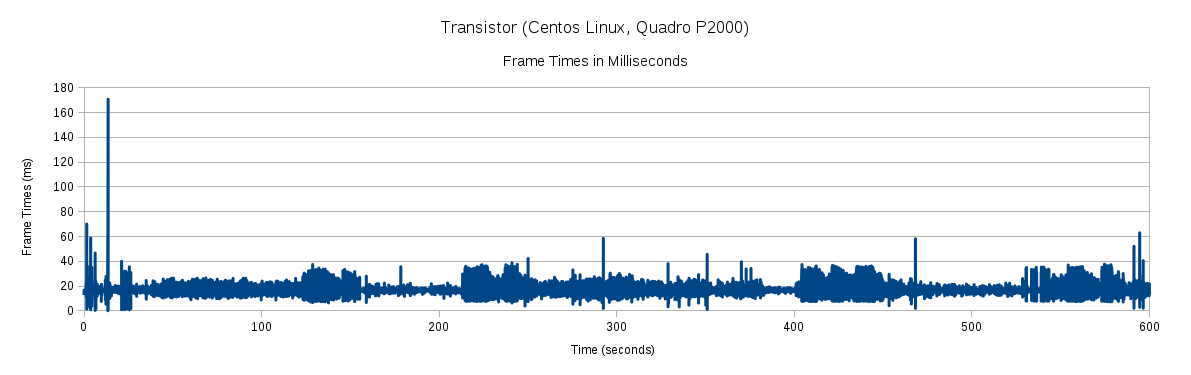
Here’s some example data I was able to pull from the game Transistor using this technique:
If you dig into the rest of the functionality of Bugle, you’ll find that it also includes an OSD with live counters and graphing, as well as screen capture and recording. There’s a lot you can do with this debugger, and frame rate logging is only scratching the surface. We plan on using this tool to bring you higher quality coverage on native gaming in the coming months.
Want more information on installing and using Bugle? Ask around in our Discord for help!
Images Via Pixabay